505 & 605
WATERFORD
OFFICE PARK
INVESTMENT HIGHLIGHTS
505 & 605 Waterford together comprise a 480,289 SF institutional-quality office park with strong US-169 frontage and visibility in NW Minneapolis.
A broad base of tenants across professional services, financial, and corporate users limits single-tenant concentration and supports stable cash flow.
Physical occupancy is projected to grow from 67.12% in-place to 80.29% over the five-year hold, driving meaningful NOI expansion.
Weighted-average expiring contract rents are below projected market rents at each major roll year, supporting durable rent growth on renewal and re-leasing.
Underwriting reflects disciplined assumptions: 3.0% CPI, transparent absorption and turnover vacancy, free-rent reserves and recovery, and a defined capex program.
Plymouth offers a deep tenant base, premium drive-times to MSP and downtown Minneapolis, and one of the strongest demographic profiles in the Twin Cities.
EXECUTIVE SUMMARY
A 480,289 SF two-building Class A office campus along the US-169 corridor in Plymouth, MN, offered with embedded lease-up upside and mark-to-market on rollover across a five-year hold.
| Field | Detail |
|---|---|
| Property | 505 & 605 Waterford Office Park |
| Location | Plymouth, Minnesota |
| Submarket | Northwest Minneapolis / US-169 |
| Asset Class | Class A Suburban Office |
| Buildings | 2 |
| Total Net Rentable Area | 480,289 SF |
| Rent Roll As Of | August 1, 2026 |
| In-Place Physical Occupancy | 67.12% |
| Stabilized Physical Occupancy (Yr 5) | 80.29% |
| Underwriting Hold Period | 5 Years |
| CPI Assumption | 3.0% |
Source: Broker Opinion of Value, March 2026

PLYMOUTH,
MINNESOTA
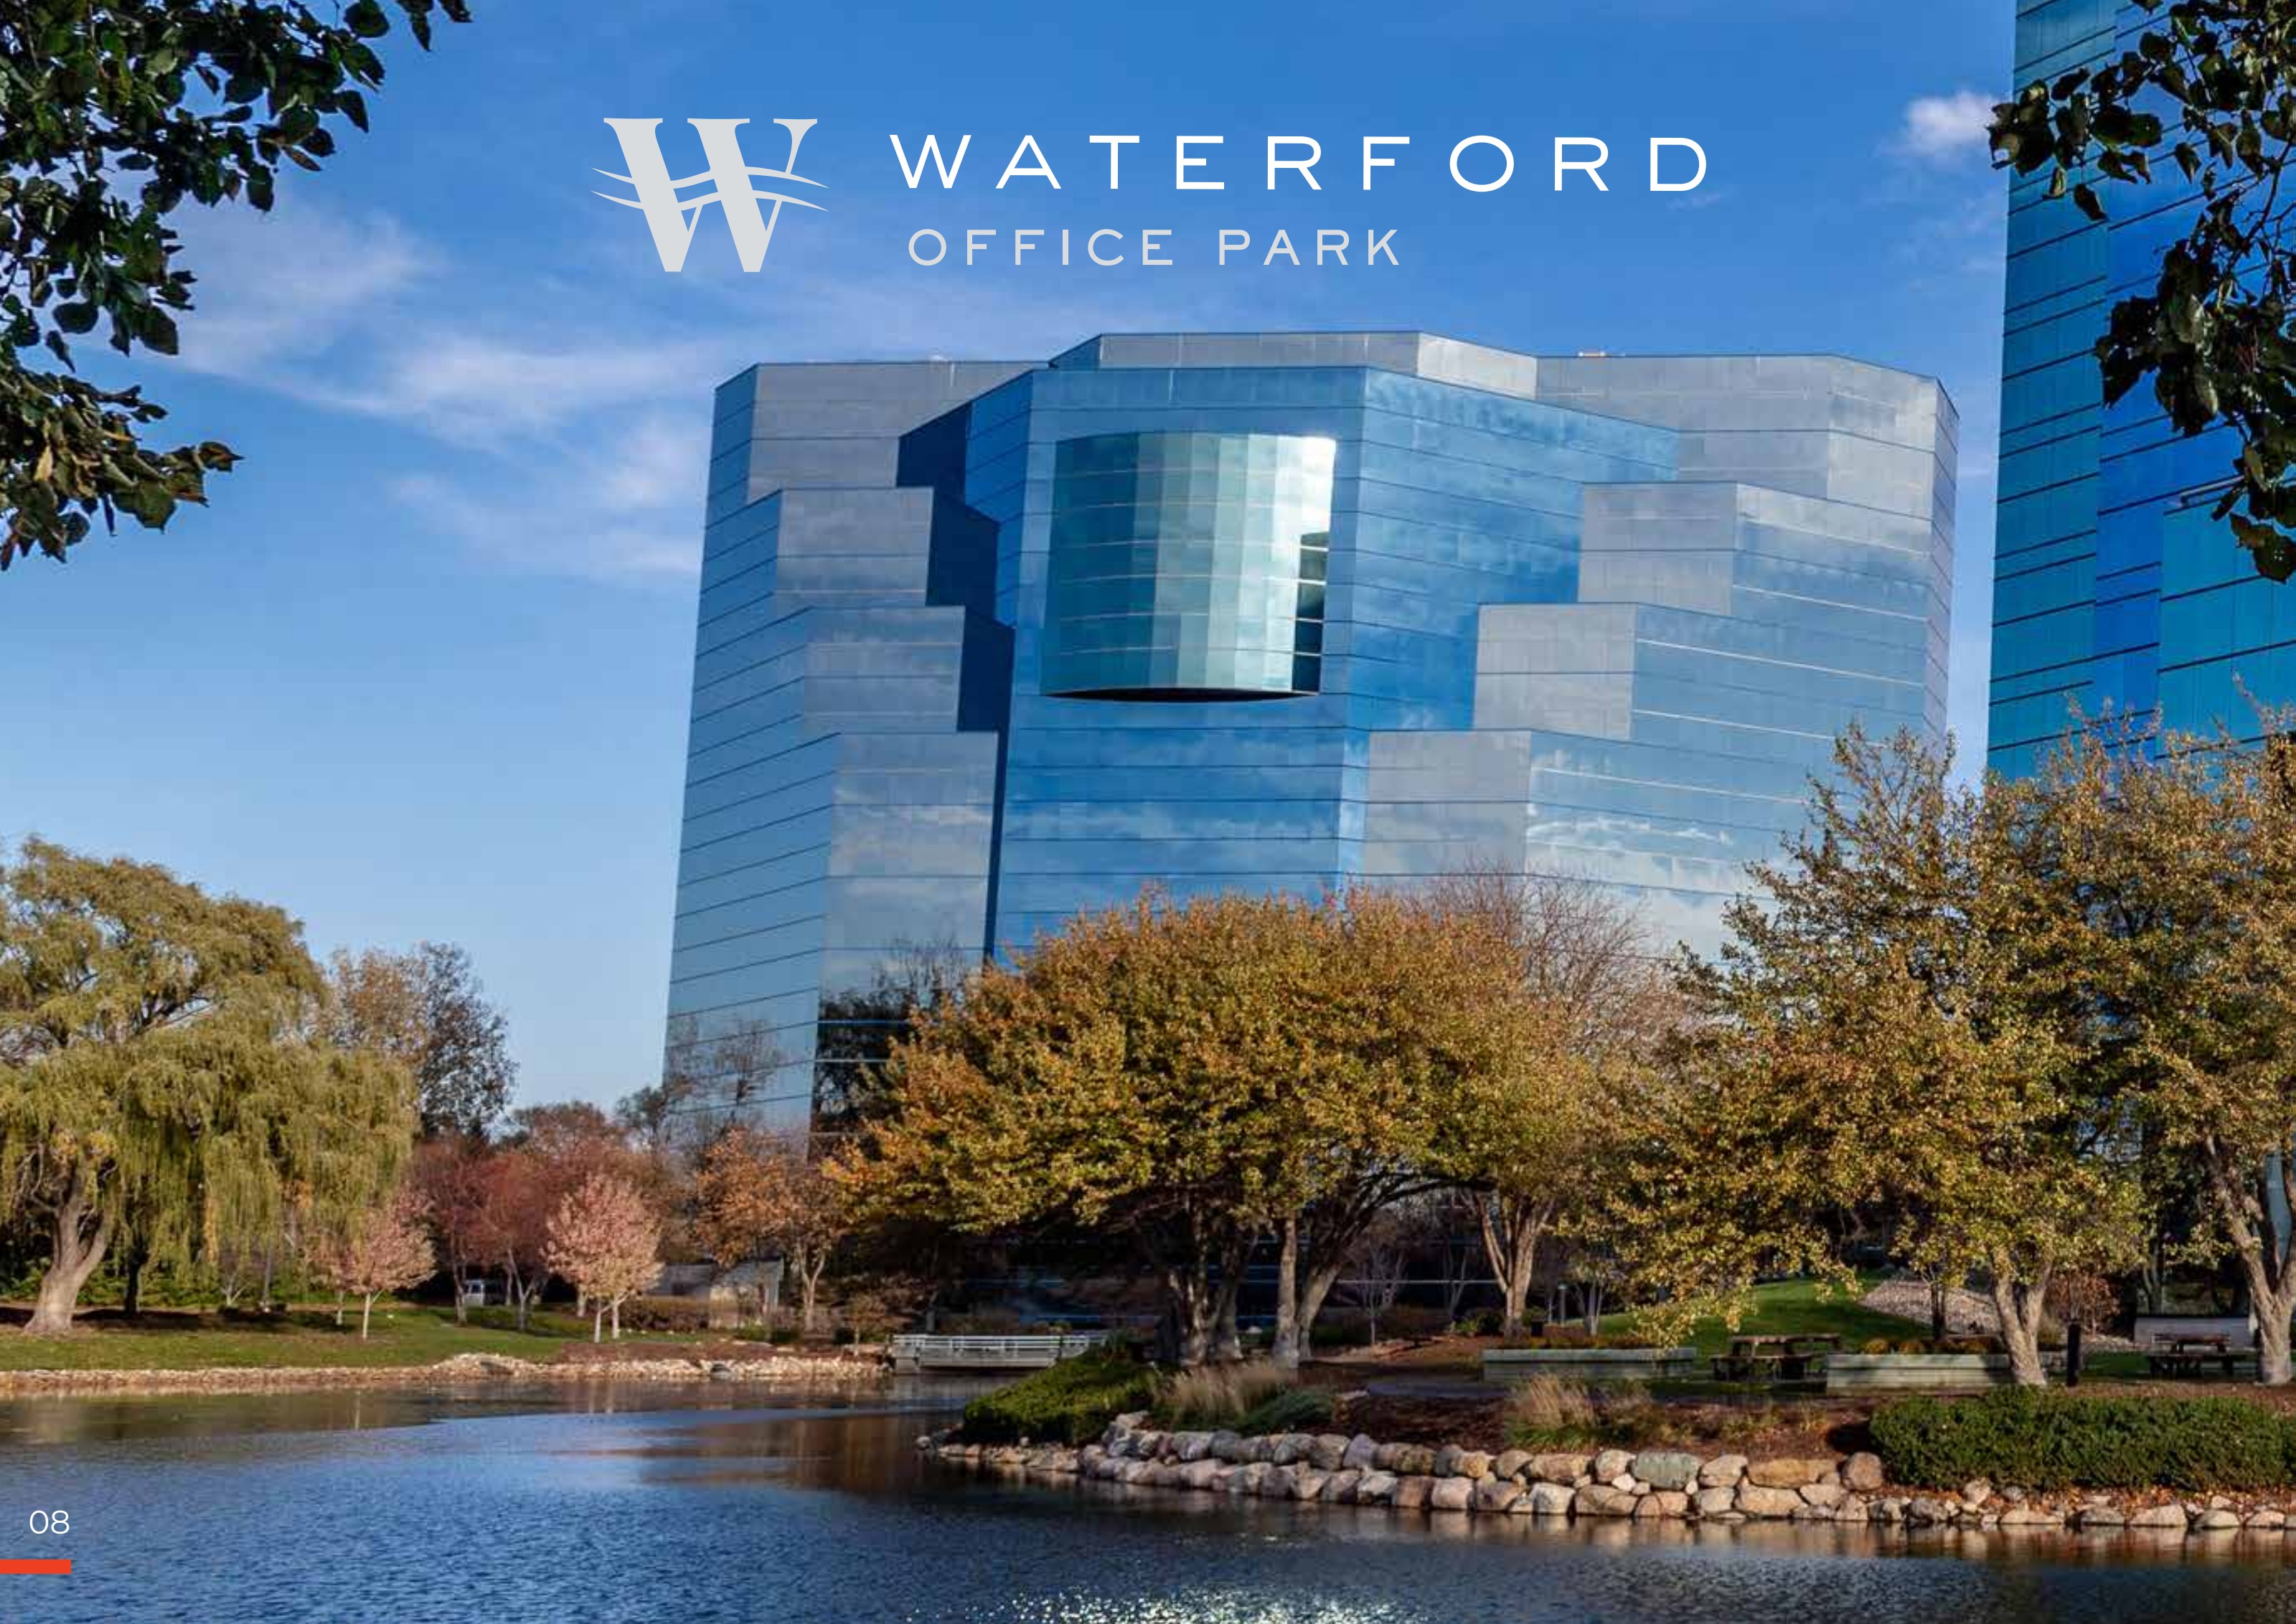
Premier Suburban Campus Location
Waterford Office Park stands as a top-tier Class A office campus that includes two buildings, situated in the high-performing I-394 Corridor office submarket of Minneapolis. Positioned just north of the intersection of I-394 and Highway 169, this prime location grants tenants easy access to a plethora of nearby conveniences, coupled with notable visibility and accessibility. Boasting a superior on-site amenity package and an office environment of the highest quality, Waterford Office Park features multiple well-appointed third workplace meeting areas, all set in a picturesque park-like setting.
The suburban markets of Minneapolis continue to attract companies seeking office spaces that align with the evolving norms of the workplace, meeting the demands of their employees. Waterford Office Park is strategically positioned to capitalize on this trend, offering employers the advantages of an urban environment in a prime suburban location.
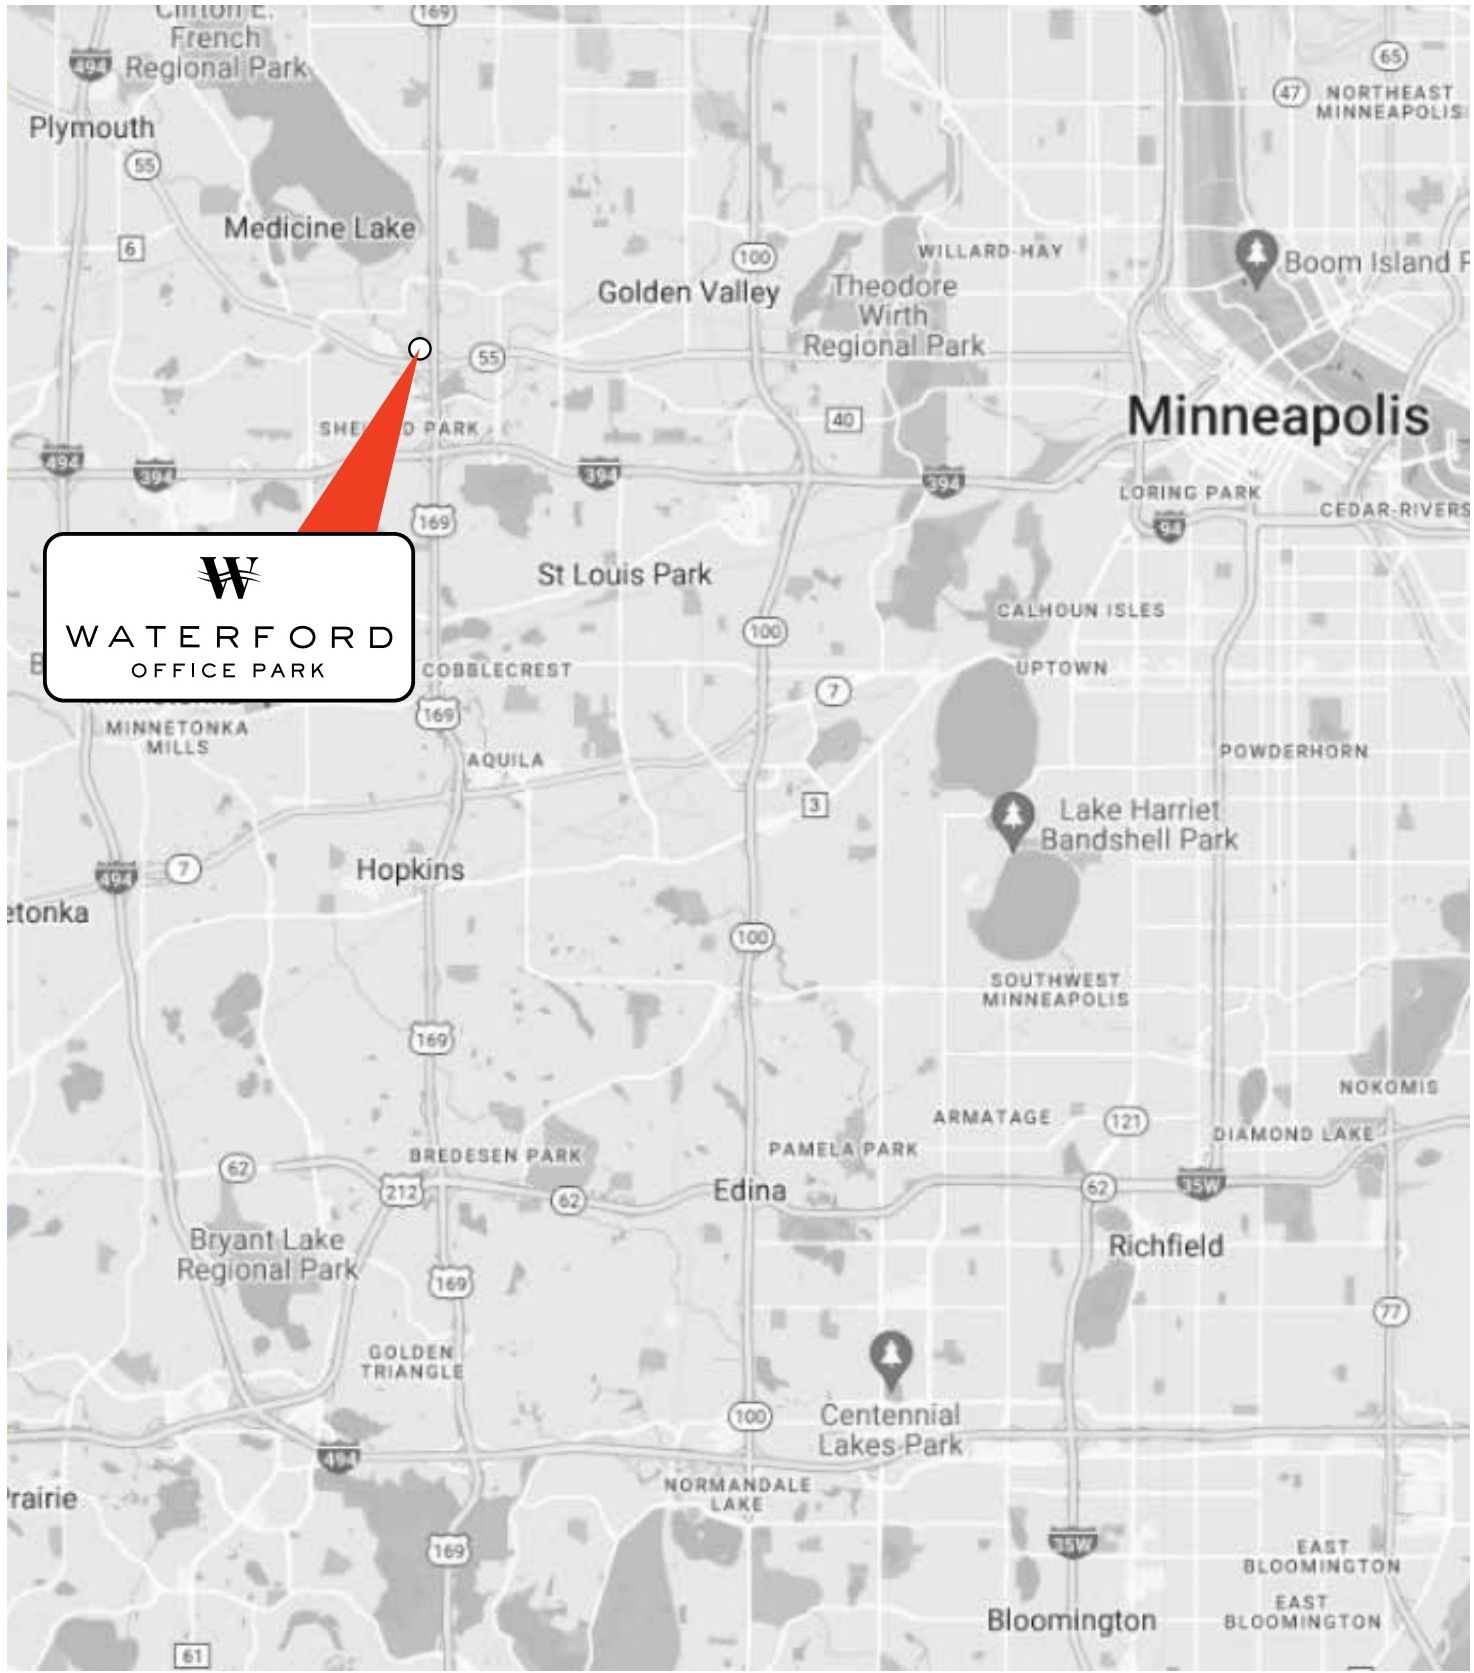
Surrounded by a wealth of work-life amenities — fast casual dining, parks, running and biking trails, hotels and entertainment venues — Waterford Office Park is minutes from the Minneapolis CBD and MSP International Airport. Its I-394 submarket location ensures superior access to executive housing and skilled labor pools across the metro's premier suburbs.
MACRO & MICRO LOCATION
- Minneapolis-Saint Paul MSA: ~3.7M residents and a diversified Fortune 500 employer base.
- Plymouth ranks among the highest median household income submarkets in the metro.
- Strong professional services, healthcare, and financial-services tenancy.
- Twin Cities office leasing led by Class A buildings with full amenity stacks.
- Prominent US-169 frontage with high daily traffic counts and signage visibility.
- ~20 min to downtown Minneapolis; ~25 min to MSP International Airport.
- Adjacent to Plymouth's premium retail, dining, and lifestyle amenity base.
- Established executive housing within a 5-mile radius supports tenant talent attraction.
ASSET OVERVIEW
| Specification | Detail |
|---|---|
| Year Built / Renovated | Class A institutional vintage |
| Floors | Mid-rise, efficient floorplates |
| Total NRA | 480,289 SF across 2 buildings |
| Parking | Surface and structured at institutional ratios |
| HVAC | VAV systems serving open-plan and private office layouts |
| Connectivity | Multiple carriers; fiber-served |
| Amenities | Conference center, fitness, dining, tenant lounge |
| Site | Prominent US-169 frontage with landscaped campus |
RENT ROLL
| Suite | Tenant | SF | % Prop | Start | Expiry | Rent $/SF | Status |
|---|---|---|---|---|---|---|---|
| 505-900 | Wealth Enchancement Group | 22,752 | 4.74% | May-2008 | Jun-2028 | $21.25 | Occupied |
| 605-400 | Winmark Corporation | 18,149 | 3.78% | Sep-2009 | Dec-2029 | $20.01 | Occupied |
| 605-700 | Atlantic Specialty Ins Co | 18,149 | 3.78% | Jul-2015 | Jul-2030 | $22.25 | Occupied |
| 605-500 | Froehling Anderson | 18,149 | 3.78% | Aug-2026 | Jun-2039 | $16.00 | Occupied |
| 605-900 | Atlantic Specialty Ins Co | 17,577 | 3.66% | Jul-2015 | Jul-2030 | $22.25 | Occupied |
| 605-800 | Atlantic Specialty Ins Co | 17,319 | 3.61% | Jul-2015 | Jul-2030 | $22.26 | Occupied |
| 505-1000 | Wealth Enhancement Group | 16,778 | 3.49% | Aug-2008 | Jun-2028 | $21.25 | Occupied |
| 505-1100 | The KNW Group | 13,973 | 2.91% | Jul-2016 | Jun-2027 | $22.15 | Occupied |
| 505-375 | Factory Mutual Insurance | 12,906 | 2.69% | Sep-2014 | Aug-2027 | $21.32 | Occupied |
| 605-650 | LB Carlson | 12,075 | 2.51% | Oct-2018 | Jun-2033 | $17.51 | Occupied |
| 505-1200 | The KNW Group | 11,765 | 2.45% | Jul-2016 | Jun-2027 | $22.15 | Occupied |
| 505-90B | Storage | 10,208 | 2.13% | Jul-2023 | Jun-2028 | — | Occupied |
| 605-310 | Winmark Corporation | 9,758 | 2.03% | Sep-2009 | Dec-2029 | $20.01 | Occupied |
| 505-500 | Nexus | 9,561 | 1.99% | Apr-2024 | Mar-2030 | $20.76 | Occupied |
| 505-400 | Calix Inc. | 8,507 | 1.77% | Feb-2019 | Jul-2029 | $21.63 | Occupied |
| 605-1000 | Wiss, Janney, Elstner Assoc | 6,694 | 1.39% | May-2009 | Aug-2029 | $20.22 | Occupied |
| 605-600 | INTL FCStone Inc. | 6,074 | 1.26% | Jan-2020 | Dec-2027 | $21.79 | Occupied |
| 605-1050 | Griffin Family Companies | 5,936 | 1.24% | Sep-2025 | Jul-2031 | $17.25 | Occupied |
| 505-350 | Courey Kosanda & Zimmer | 5,624 | 1.17% | Mar-2012 | May-2032 | $21.45 | Occupied |
| 605-150 | Winmark Corporation | 5,606 | 1.17% | Mar-2009 | Dec-2029 | $20.01 | Occupied |
| 505-465 | Dosentrx | 5,387 | 1.12% | Dec-2025 | Nov-2030 | $19.50 | Occupied |
| 505-100 | Carlson SV | 4,969 | 1.03% | Jun-2025 | Jun-2036 | $17.50 | Occupied |
| 605-100 | Platinum Bank | 4,581 | 0.95% | Oct-2016 | Oct-2029 | $21.22 | Occupied |
| 505-10 | Fitness Center | 4,347 | 0.91% | Aug-2018 | Dec-2049 | — | Occupied |
RENT ROLL
| Suite | Tenant | SF | % Prop | Start | Expiry | Rent $/SF | Status |
|---|---|---|---|---|---|---|---|
| 605-1025 | Rise Modular | 4,118 | 0.86% | Jan-2026 | Jul-2027 | $20.00 | Occupied |
| 605-300 | Winmark Corporation | 3,903 | 0.81% | Sep-2009 | Dec-2029 | $20.01 | Occupied |
| 605-320 | Winmark Corporation | 3,600 | 0.75% | Sep-2009 | Dec-2029 | $20.01 | Occupied |
| 605-200 | Superior Wealth | 3,386 | 0.70% | May-2019 | Sep-2034 | $22.14 | Occupied |
| 505-550 | Rice Park Capital Management | 3,016 | 0.63% | Nov-2022 | Apr-2029 | $20.50 | Occupied |
| 505-255 | Three Bays | 2,959 | 0.62% | Feb-2025 | Apr-2027 | $17.50 | Occupied |
| 505-260 | Vantage Point Wealth Mgmt | 2,789 | 0.58% | Mar-2018 | Oct-2029 | $19.63 | Occupied |
| 505-150 | Griffin Family Companies | 2,763 | 0.58% | Aug-2025 | Dec-2030 | $17.77 | Occupied |
| 505-75 | Conference Center | 2,624 | 0.55% | Jul-2023 | Jun-2028 | — | Occupied |
| 505-45 | Signature Classics | 2,622 | 0.55% | Oct-2011 | Jul-2027 | $9.15 | Occupied |
| 505-555 | Nexus | 2,575 | 0.54% | May-2016 | Mar-2030 | $20.76 | Occupied |
| 505-595 | Quazar Capital Corporation | 2,572 | 0.54% | Feb-2023 | Oct-2030 | $19.92 | Occupied |
| 605-LL-1 | Property Management | 2,535 | 0.53% | Aug-2016 | Dec-2049 | — | Occupied |
| 605-125 | Waterford Lounge | 2,429 | 0.51% | Oct-2015 | Dec-2049 | — | Occupied |
| 505-45a | Cafe Seating Area | 2,193 | 0.46% | Aug-2018 | Dec-2049 | — | Occupied |
| 505-295 | ACOVA | 2,048 | 0.43% | Mar-2022 | Jun-2027 | $0.02 | Occupied |
| 505-245 | NBGC | 2,015 | 0.42% | Dec-2024 | Feb-2032 | $18.54 | Occupied |
| 505-275 | Tuft, Lach, Jerabek | 1,860 | 0.39% | Apr-2025 | Aug-2030 | $18.00 | Occupied |
| 605-LL-5 | Fitness Center | 1,659 | 0.35% | Oct-2009 | Dec-2049 | — | Occupied |
| 605-230 | Rainbow Energy Marketing Corp | 1,249 | 0.26% | Jan-2007 | Apr-2027 | $19.57 | Occupied |
| 505-285 | Greycoach Properties | 1,057 | 0.22% | Oct-2013 | Mar-2027 | $23.07 | Occupied |
| 605-LL-4 | Bldg | 407 | 0.08% | Oct-2009 | Dec-2049 | — | Occupied |
| 605-120 | Bldg Storage | 112 | 0.02% | Oct-2015 | Dec-2049 | — | Occupied |
| 505-600 | Vacant | 24,444 | 5.09% | — | — | — | Vacant |
RENT ROLL
| Suite | Tenant | SF | % Prop | Start | Expiry | Rent $/SF | Status |
|---|---|---|---|---|---|---|---|
| 605-1100 | Vacant | 15,824 | 3.29% | — | — | — | Vacant |
| 605-1200 | Vacant | 14,737 | 3.07% | — | — | — | Vacant |
| 505-800 | Vacant | 14,736 | 3.07% | — | — | — | Vacant |
| 505-700 | Vacant | 12,051 | 2.51% | — | — | — | Vacant |
| 505-750 | Vacant | 11,794 | 2.46% | — | — | — | Vacant |
| 505-850 | Vacant | 7,972 | 1.66% | — | — | — | Vacant |
| 505-560 | Vacant | 7,290 | 1.52% | — | — | — | Vacant |
| 505-1050 | Vacant | 5,936 | 1.24% | — | — | — | Vacant |
| 505-450 | Vacant | 5,925 | 1.23% | — | — | — | Vacant |
| 505-175 | Vacant | 4,063 | 0.85% | — | — | — | Vacant |
| 605-240 | Vacant | 3,346 | 0.70% | — | — | — | Vacant |
| 505-455 | Vacant | 3,259 | 0.68% | — | — | — | Vacant |
| 505-365 | Vacant | 2,808 | 0.58% | — | — | — | Vacant |
| 505-230 | Vacant | 2,769 | 0.58% | — | — | — | Vacant |
| 505-170 | Vacant | 2,723 | 0.57% | — | — | — | Vacant |
| 505-325 | Vacant | 2,677 | 0.56% | — | — | — | Vacant |
| 505-90 | Vacant | 2,598 | 0.54% | — | — | — | Vacant |
| 605-220 | Vacant | 2,527 | 0.53% | — | — | — | Vacant |
| 505-90a | Vacant | 2,252 | 0.47% | — | — | — | Vacant |
| 605-250 | Vacant | 1,771 | 0.37% | — | — | — | Vacant |
| 505-460 | Vacant | 1,712 | 0.36% | — | — | — | Vacant |
| 505-195 | Vacant | 760 | 0.16% | — | — | — | Vacant |
Source: Broker Opinion of Value, March 2026 · 70 suites · Escalations, free rent, recovery type, TI/LC, and market assumptions available on request.
FINANCIAL OVERVIEW
| Year | Phys. Occ. | Econ. Occ. | Absorp. | Turnover | Free Rent | Free Rec. |
|---|---|---|---|---|---|---|
| FY27 | 67.12% | 56.84% | 7.20% | 11.10% | 8.95% | 6.30% |
| FY28 | 71.40% | 68.10% | 5.15% | 12.05% | 6.45% | 4.85% |
| FY29 | 75.20% | 74.20% | 3.40% | 11.60% | 3.95% | 3.55% |
| FY30 | 78.55% | 77.05% | 2.80% | 12.10% | 3.50% | 3.10% |
| FY31 | 80.29% | 79.00% | 1.85% | 12.50% | 2.80% | 2.95% |
Source: Broker Opinion of Value, March 2026 · CPI 3.0% · Pricing & debt assumptions omitted.
BUSINESS PLAN
Capture absorption to grow physical occupancy from 67.12% to 80.29% through a targeted leasing program focused on small- and mid-floor users.
Renew and re-lease at projected market rents that exceed weighted-average expiring contract rents at every roll year FY28–FY32+.
Deploy a defined capex plan covering tenant improvements, common-area refresh, and base-building items underwritten in the business plan.
Tighten OpEx and recoveries through active asset management; assume 3.0% CPI growth across underwriting horizon.
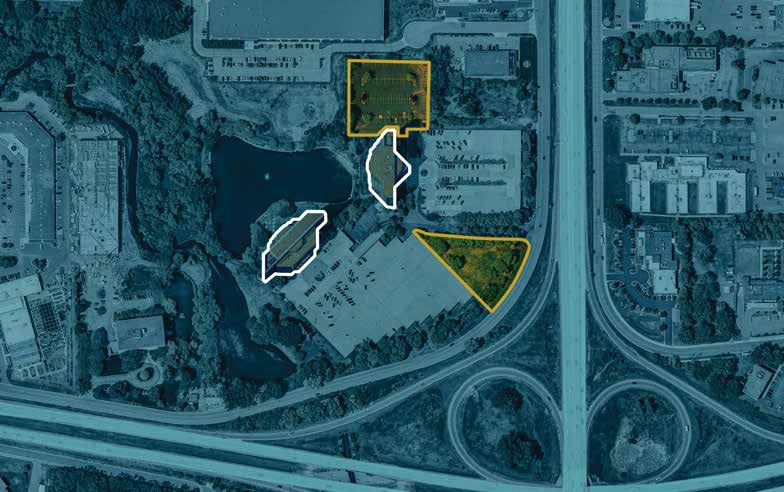
Additional Development Opportunities
The package includes two surplus land parcels for potential future development — a roughly 1.25+/- acre tract situated at the entrance driveway to the park and a roughly 2.0+/- acre parcel on the North side of 605 Waterford. Both parcels currently function as surplus surface parking and hold Business Campus District zoning. The parcels present additional value-add opportunities for prospective investors.
Note: the land parcels are currently undivided and lack separate subdivision or parceling.
MARKET COMPARABLES
Framework reserved for leasing and sale comparables. Specific comp sets to be provided and validated against the most recent market intelligence prior to launch.
| Property | Submarket | Size | Rent $/SF |
|---|---|---|---|
| Comp 1 | NW Mpls / US-169 | — | — |
| Comp 2 | NW Mpls / US-169 | — | — |
| Comp 3 | NW Mpls / US-169 | — | — |
| Comp 4 | NW Mpls / US-169 | — | — |
| Property | Submarket | Size | Date |
|---|---|---|---|
| Comp 1 | NW Mpls / US-169 | — | — |
| Comp 2 | NW Mpls / US-169 | — | — |
| Comp 3 | NW Mpls / US-169 | — | — |
| Comp 4 | NW Mpls / US-169 | — | — |
To be provided · No legacy figures retained from prior offering materials.
ESG, SPECS & AMENITIES
Modern VAV HVAC, LED retrofits, and BMS controls support efficiency targets.
On-site fitness, conferencing, dining, and tenant lounge enable hybrid-era workplaces.
Surface and structured parking, EV-readiness, and direct US-169 access.
Floor-to-ceiling glass, efficient floorplates, and active landscaping support occupant wellness.
DEMOGRAPHICS & CONNECTIVITY
Plymouth combines a dense, affluent population base with a deep daytime employer pool and frictionless access to the broader Twin Cities economy.
RISKS & MITIGANTS
| Risk | Mitigant |
|---|---|
| Office Market Vacancy | Class A campus with amenity depth; underwriting reflects realistic absorption and downtime. |
| Tenant Rollover Exposure | Granular rent roll spreads roll across multiple years; below-market expiring rents support renewals. |
| Capital Markets Volatility | Institutional asset with durable in-place cash flow and embedded NOI growth provides multiple exit paths. |
| Concession Environment | Free-rent reserves and recovery captured in cash-flow underwriting; TI levels benchmarked to market. |
APPENDIX
| Year | Expiring SF | Avg Contract Rent | Avg Market Rent | Note |
|---|---|---|---|---|
| 2027 | 0 | — | — | No material expiries |
| 2028 | 59,844 | $16.78 | $19.50 | Mark-to-market opportunity |
| 2029 | 102,725 | $16.96 | $19.85 | Largest roll year |
| 2030 | 57,171 | $17.42 | $20.10 | — |
| 2031 | 65,820 | $18.00 | $20.40 | — |
| 2032+ | 81,391 | $18.55 | $20.80 | Long-term, escalating leases |
Source: Broker Opinion of Value, March 2026 · Weighted-average expiring contract vs. projected market rent.
All tenancy, SF, lease dates, base rents, escalations, free-rent, occupancy and cash-flow figures are sourced from the March 2026 broker opinion of value. Underwriting assumes 3.0% CPI. Asking price, cap rate, IRR and debt assumptions have been deliberately omitted from this presentation.
Some of the statements contained in this Memorandum are forward-looking statements. These statements involve known and unknown risks, uncertainties and other factors that may cause actual results, levels of activity, performance, or achievements of the Sponsor or the Property to be materially different from any future results, levels of activity, performance or achievements expressed or implied by these forward-looking statements. A number of these factors are described in the "Risk Factors" section and other sections of this Memorandum. In some cases, a forward-looking statement can be identified by the use of terminology such as "may," "will," "should," "could," "expects," "plans," "anticipates," "believes," "estimates," "predicts," "potential," or "continue," or the negative of these terms or other similar terminology.